A brand funnel is a concept in marketing that explains the journey a customer takes from first...

Creating perceptual maps from survey data is a valuable technique utilized in market research to gain insights into how customers perceive brands, products, or services. Analyzing survey responses and assigning scores to various attributes and competing brands can help businesses visually represent and compare the competitive landscape.
Perceptual maps provide a clear and concise visualization that aids decision-making processes such as product development, marketing strategies, and brand positioning.
Here, we will explore the step-by-step process of creating a perceptual map, highlighting the importance of identifying determinant attributes, designing effective surveys, analyzing data, and plotting the brands on a two-dimensional map.
What Are Perceptual Maps?
Perceptual maps, also known as positioning maps, are potent survey data collection tools businesses use to visually analyze how their audience perceives their product or service. These maps offer valuable insights into the thoughts and feelings of customers compared about your product compared to a competitor’s offerings.Perceptual maps provide businesses with a comprehensive view of how their target audience feels about their brand or product. By plotting customer perceptions and preferences on the map, companies can identify the strengths and weaknesses of their brand relative to competitors. This information enables organizations to make impactful, data-driven decisions about their marketing strategies, product development, and overall brand positioning.
To create a perceptual map, market researchers gather data through customer surveys and inquire about their experiences with a specific product, service, or brand. The survey questions can cover various attributes relevant to the brand or product.
For example, these surveys may ask customers about their feelings regarding the product's usefulness, packaging, price, size, and other pertinent factors. Collecting data on these attributes gives researchers a holistic view of how customers perceive various aspects of the brand or product.
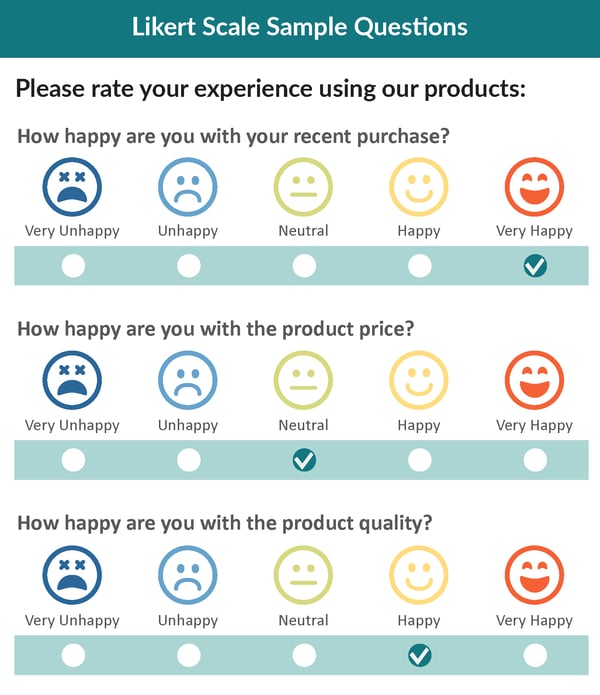
Next, researchers employ a scale, such as the Likert scale, to allow respondents to provide their opinions or ratings on different attributes, which can then be quantified and plotted accordingly. The resulting perceptual map visually represents the collected data, making it easier for businesses to interpret and analyze the findings.
The insights gained from perceptual maps can be instrumental in shaping business decisions. Analyzing the plotted data can help organizations identify patterns, trends, and gaps in the market. These gaps often indicate unmet customer needs or untapped opportunities that businesses can use to make informed choices about developing new products, enhancing existing product lines, or adjusting their marketing strategies to better align with customer preferences.
What Are the Benefits of Perceptual Maps?
Perceptual maps offer numerous benefits for businesses conducting market research. These visual tools provide valuable insights into how consumers perceive products or services, offer a framework for strategic decision-making, and aid in developing effective marketing strategies.
Below are the key benefits of utilizing perceptual maps:
- Understand Consumer Perception: Perceptual maps help businesses understand how consumers perceive their products or services compared to their competitors.
- Identify Market Gaps: Perceptual maps allow enterprises to identify gaps in the market where potential opportunities for new products or services exist.
- Create Effective Marketing Strategies: The visual clarity provided by perceptual maps allows businesses to develop more effective marketing strategies and align their messaging, positioning, and branding to improve customer perceptions.
- Identify Key Consumer Attributes: Perceptual maps help define the key attributes consumers consider before buying a product. With help from the map, organizations can discern which product characteristics or brand elements have the most significant impact on consumer purchases.
- Differentiation and Repositioning: Analyzing the perceptual map can help businesses pinpoint areas where their offerings overlap with competitors and seek avenues for differentiation to stand out.
- Target Under-served Segments: Identifying gaps in the map where competitors are not effectively meeting the needs of specific consumer groups can help businesses tailor their offerings to target under-served segments, thereby expanding their customer base and market reach.
Types of Perceptual Maps
Perceptual maps come in different types, each serving specific purposes and providing varying levels of detail. The two main types are two-dimensional perceptual maps and multi-dimensional perceptual maps.
Two-Dimensional Perceptual Maps
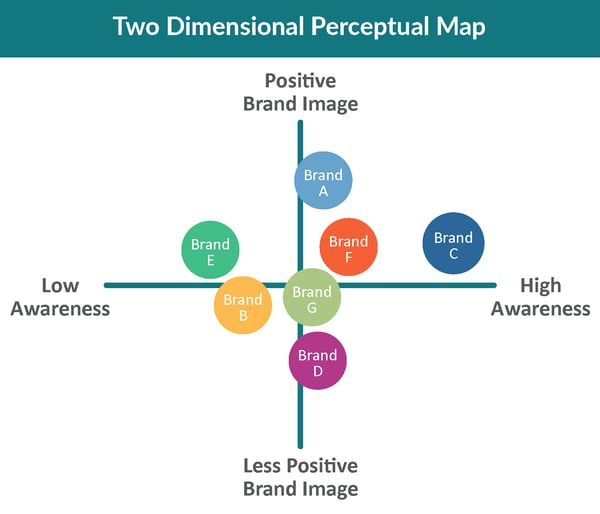
Two-dimensional perceptual maps are the standard type of perceptual map. They use two axes to visualize the collected data and represent key findings. Two-dimensional perceptual maps are easy to understand and analyze, making them commonly used in marketing and product management.
- They provide a clear visual representation of how customers perceive brands or products relative to each other.
- The two axes represent specific attributes or dimensions important to the target audience.
- By plotting data on these axes, businesses can identify the positioning of their brand or product and make informed decisions based on the insights gained.
Multi-Dimensional Perceptual Maps
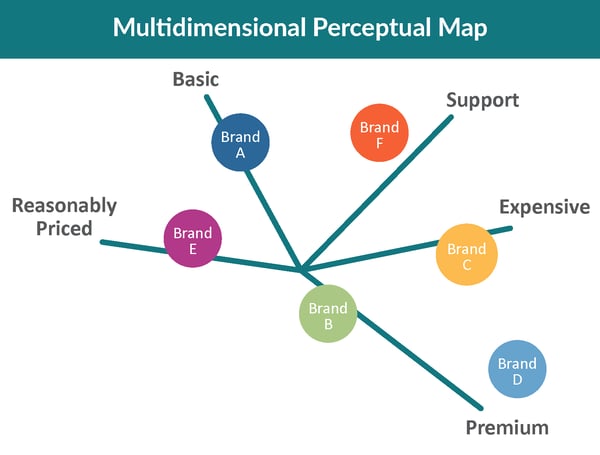
Multi-dimensional perceptual maps go beyond the two-dimensional format and incorporate more than two dimensions for parameters. As a result, these maps provide in-depth information and a more comprehensive understanding compared to their two-dimensional counterparts.
- Multi-dimensional perceptual maps offer the ability to explore multiple attributes, factors, or dimensions simultaneously.
- They provide deeper analysis and insights by considering a broader range of variables.
- Due to their complexity, multi-dimensional perceptual maps can be challenging to understand without the assistance of experts like IntelliSurvey, who offer advanced research and analytics services.
- These maps are often used in large-scale research projects to reveal essential insights and information about the marketplace.
- They enable businesses to uncover complex relationships and patterns that may not be apparent in two-dimensional maps, facilitating strategic decision-making based on comprehensive data analysis.
How to Create Perceptual Maps From Survey Data (Step-by-Step)
Creating perceptual maps from survey data involves a step-by-step process that enables businesses to gain valuable insights into customer perceptions. By using the following steps, organizations can visually represent survey data and uncover meaningful patterns and relationships:
- Identify the Determinant Attributes
- Create and Send Out a Survey
- Assign Scores to Competing Brands
- Create the Perceptual Map
1. Identify the Determinant Attributes
Determinant attributes are key variables that customers consider when deciding whether to make a purchase. In addition, determinant attributes are crucial in distinguishing competitive offerings within the market. The specific attributes of a study may vary depending on the topic, product, or service.
To identify the determinant attributes, consider the attributes that are most critical to the average customer experience. For example, if conducting a study on coffee preferences, determinant attributes may include taste, aroma, price, packaging, ethical sourcing, and overall convenience.
2. Create Your Survey
The next step is to create an effective survey tailored to the appropriate audience and acquire a relevant data set for your study. Using the previous example, the survey should focus on capturing information about the desired attributes of various competing coffee products.
When designing the survey, keep it concise and focused to ensure it addresses the key attributes and objectives of the study. To gather both quantitative and qualitative data, utilize a combination of question types, such as multiple-choice, Likert scale, and open-ended questions.
3. Send Out Your Survey
Finding the right audience can significantly impact the quality and accuracy of the data collected; that's why it is critical to employ effective strategies for survey distribution.
One method to consider is a blended panel approach. For example, IntelliSurvey provides businesses access to diverse and targeted panels of respondents who match specific demographics, interests, or characteristics. By utilizing a multi-panel approach, researchers can ensure that their survey reaches the appropriate target audience each time, increasing the likelihood of obtaining accurate and meaningful data.
In addition to using specialized services, other methods can help reach the desired audience. These may include leveraging existing customer databases, partnering with relevant industry associations or organizations, utilizing social media platforms, and employing targeted advertising campaigns. Again, the goal is to maximize the survey's exposure to the intended audience and ensure that the collected data is representative of the target population.
4. Assign Scores to Competing Brands
Assigning scores to competing brands based on the survey results allows researchers to analyze the differences in customer perceptions towards similar competitor product offerings. This analysis involves examining qualitative responses obtained from open-ended survey questions.
Begin by identifying recurring attributes mentioned by customers in their responses. Next, apply these attributes to numerical scales (or give them a score). Using these attributes in numerical scales enables researchers to quantify the qualitative data.
Scores help researchers determine which attributes customers perceive as most important and which brands excel in providing those specific attributes. These scores provide a quantifiable measure of customer perception by determining how the average customer feels about a brand's product offering.
One effective way to visualize the open-ended survey responses is by incorporating a word cloud in your reporting platform. A word cloud visually represents the most popular words mentioned by customers, giving a quick overview of the prevalent attributes or sentiments associated with the brand.
5. Create a Two-Dimensional Perceptual Map
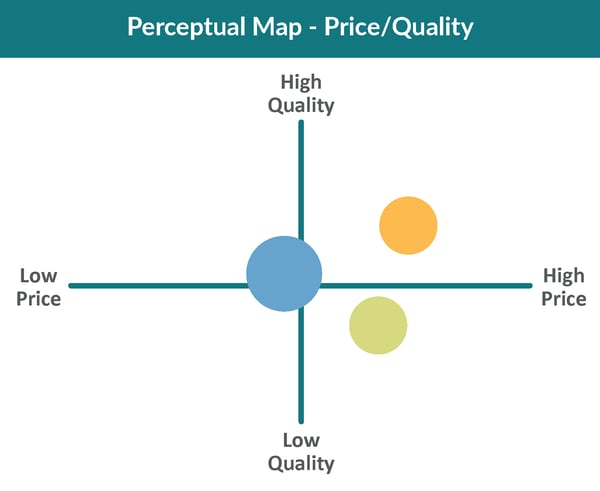
After assigning scores to each brand based on customer responses, it's time to construct a two-dimensional perceptual map. This perceptual map will visually compare each brand based on its different attributes.
To create the perceptual map, start by plotting the brands accordingly. The X and Y axes of the map typically represent different attributes that are important to customers. The scores assigned to each brand determine their position on the map, indicating how they stack up against each other in terms of these attributes.
Use Cases for Perceptual Maps
Perceptual maps have diverse applications across various aspects of business and marketing. They provide valuable insights that can inform decision-making and strategy development. Here are some key areas where researchers can utilize perceptual maps.
Product Launches
Perceptual maps can guide product launches by identifying market gaps and unmet needs and informing decisions on product positioning, features, and target audience.
For example, researchers might use perceptual maps to answer questions like:
- How does our new product compare to existing offerings?
- What attributes are essential to customers in this product category?
Marketing Campaigns
The insights from perceptual maps can shape marketing campaigns and communication strategies. Understanding how consumers perceive brands and their competitors can assist marketers in messaging and positioning to effectively differentiate their products.
Perceptual maps can help answer questions such as:
- How do customers currently perceive our messaging compared to competitors?
- How can we adjust our marketing strategies to resonate with a specific audience?
Customer Engagement
Perceptual maps can aid in understanding customer preferences and expectations, facilitating better customer engagement strategies. Analyzing how customers perceive different attributes can help businesses align their offerings with customer desires, increasing satisfaction and loyalty.
Researchers might explore questions such as:
- What attributes do customers value most in our industry?
- How can we better meet customer needs and expectations?
Brand Identity
Perceptual maps can assist in establishing and managing brand identity. They provide insights into how customers perceive brands and their associations with specific attributes. As a result, businesses can use perceptual maps to shape their brand's positioning and differentiate themselves from competitors.
Researchers may seek answers to questions like:
- What attributes are strongly associated with our brand?
- How can we strengthen our brand identity and build a unique brand image?
How IntelliSurvey Can Help
By leveraging perceptual maps, businesses can understand customer impressions, align their strategies with market dynamics, and make data-driven decisions across product launches, marketing campaigns, customer engagement, and brand development. The insights derived from perceptual maps help businesses stay competitive and drive growth and success in their respective industries.
IntelliSurvey can provide the necessary tools and expertise to help you get the most out of your survey data. We focus on delivering actionable, intelligent insights that can support better decision-making for businesses of all sizes. Contact us today to learn more.

Subscribe to our Monthly Newsletter
Related posts


Competitive benchmarking helps organizations gain a competitive edge in their respective...

Analyzing brand funnel metrics is crucial for any business wanting to understand its target market...