Data quality, reliability, and integrity are paramount in survey research. Survey data cleaning...

Calculating the margin of error is vital to research and survey data collection. Researchers rely on the margin of error to tell them how reliable their data is. The margin of error lets them know how many percentage points off their results could be from the actual population value. Read on to learn more about margin of error and how to calculate it.
What Is Margin of Error?
Margin of error is a figure that represents the extent of uncertainty that your research or survey results may have. The margin of error is provided with research and statistics such as polls, surveys, and other studies because it tells readers how much more or less the actual population may differ from the data given. It is denoted with a positive and negative sign in front of a percentage, since your results might differ from the true population in either direction.
When Is Margin of Error Used?
Margin of error is used whenever researchers select a random sample to represent an entire population. Surveys that use random respondents to represent a larger population must include a margin of error. In surveys and similar studies, the margin of error is included to tell the reader how reliable the data is.
For example, it would not be realistic to poll the entire population of Los Angeles. In this scenario, you would choose a set of people to represent the whole population of Los Angeles for your results. For cases like these, you will need to calculate the margin of error to determine how accurate your data is.
It is not appropriate to calculate the margin of error if you selected your sample using a method that is not random; for example, selecting respondents because they have specific characteristics.
How Do You Calculate Margin of Error
We’ve written out the margin of error equation to make it simple for you to calculate your survey’s margin. To calculate the margin of error, use the formula and follow the steps below.
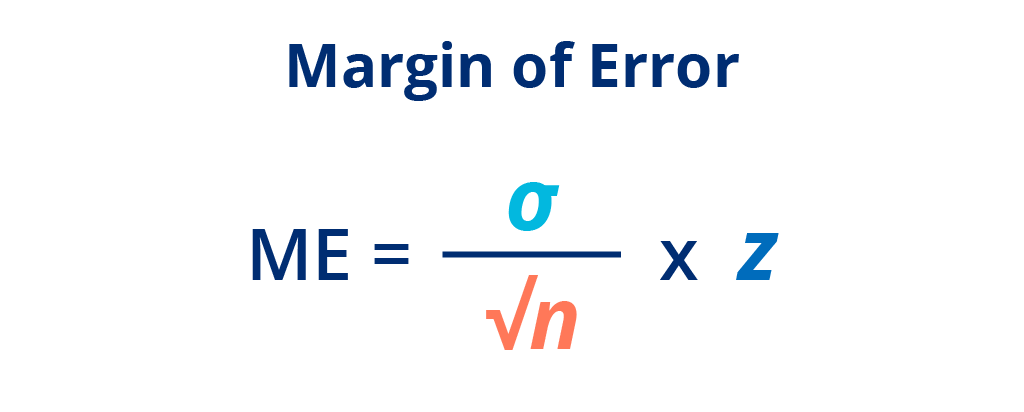
- Find your population standard deviation (σ) and sample size (n).
- Once you have found your population standard deviation and sample size, take the square root of your sample size and divide it by the population standard deviation.
- Multiply the resulting number by a z-score that is consistent with your desired confidence level.
How to Determine Population Standard Deviation
Standard deviation measures the usual distance between each data point and the mean. In studies where the data is a smaller sample representing an entire population, you would divide by one less than the number of data points in the collected sample (n-1). To calculate the population standard deviation, refer to the formula and steps below:
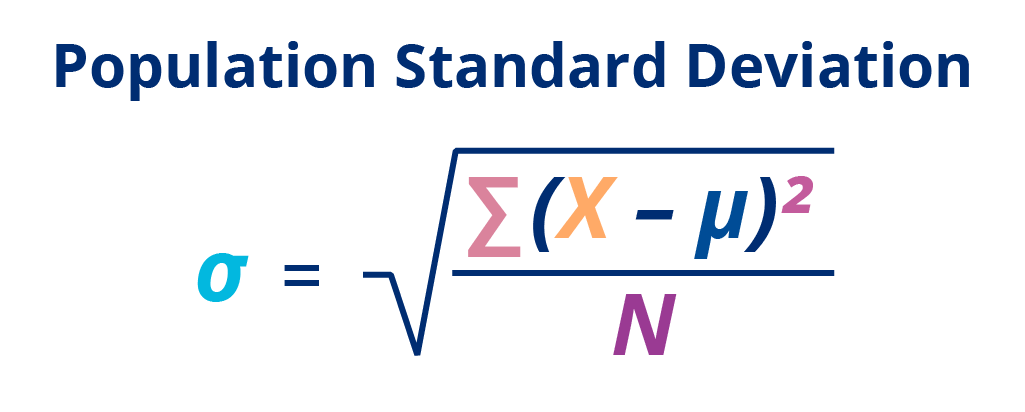
- Calculate the mean of the data.
- Subtract the mean from all of your data points. The difference between the mean and each data point is a deviation. If the data points are below the mean, then they are negative deviations, while data points above the mean are positive deviations.
- Square your deviations to make them positive numbers. Multiply a number by itself to find its square number.
- Add all of your squared deviations together.
- Divide the sum of squared deviations by the number of data points in the population. This number is your variance.
- To find your standard deviation, take the square root of your variance.
What Are Z-Scores?
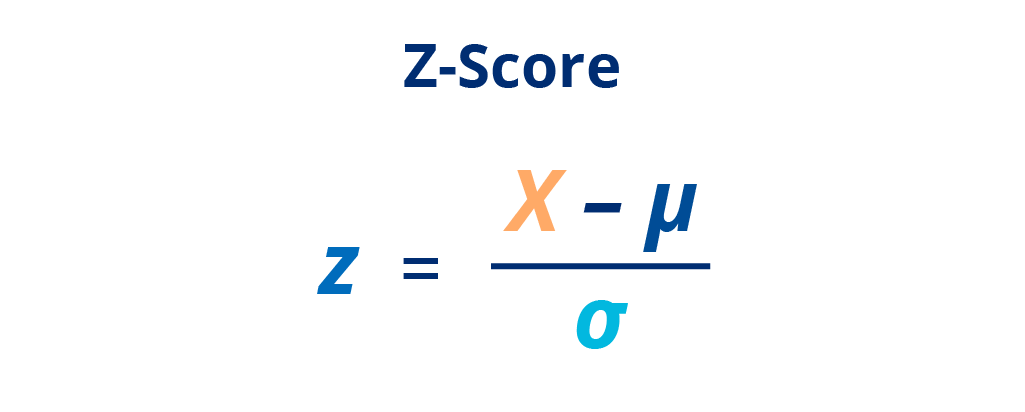
Z-scores are a numeric representation of the desired confidence level. The z-score tells you how many standard deviations from the mean your score is. The most common percentages you will find are 90%, 95%, and 99%. You can calculate your z-score using the formula below.
Z-score formula: z = (x – μ) / σ
x: observed value (the number of observations in a sample that belong to a category)
μ: mean of the sample
σ: population standard deviation
Sample Sizes Explained
Sample size simply refers to counting the number of observations being made or samples being measured. Sample sizes are important to pay attention to in public opinion surveys and similar studies. If a sample size is too small, it could result in inaccurate results about a larger overall population. However, a sample size that is too large can require too much time and resources to go through. It is also equally important to choose a sample that accurately represents the overall population.
Representative sampling is a sampling method that enables the delivery of a data set that accurately reflects a population. A sample that accurately represents a population or demographic is important in political polling and brand surveys. For example, a dog food brand that is conducting a survey about what people think of their product is not likely to have many non-dog owners in their sample. Many brands and businesses rely on solutions like IntelliSurvey’s sampling services to help take the guesswork out of collecting sample data.
How to Reduce Your Margin of Error
For many researchers and business owners studying a population or target market, it is crucial to collect the most reliable data possible. Reducing the margin of error is a great way to produce a more reliable survey or study that helps better understand the population or sample you are researching. These are some of the best practices you can utilize to improve the margin of error and ensure that your data is as precise as it can be.
1. Reduce Data Variability
Less data variation leads to a more accurate estimate regarding a parameter surrounding your population. Generally, having more variables in your study increases the likeliness of errors. This method also helps reduce the standard variation.
2. Use a Larger Sample Size
Using a larger sample size can help reduce the margin of error by making more observations and acquiring a better approximation of the population parameter. While using a larger sample size can be appropriate for bigger populations, it can require a lot of time and resources to collect and analyze the data.
3. Lower the Confidence Level
Using a lower confidence level will provide you with a more precise margin of error; however, lowering your confidence level reduces the confidence that your survey or study will accurately represent the population you are researching.
Why Is Survey Margin of Error so Important?
Why use a margin of error for a survey, anyway? Well, a survey margin of error indicates how closely you can expect the survey results to be in relation to the population value.
For surveys, it’s recommended to aim for 4-8% margin of error with 95% confidence. This can vary quite significantly based on the original sample size, the target population size and other factors, but ideally you’d like to be as certain as possible for your data.
How IntelliSurvey Can Help
Calculating and providing the margin of error is vital to the credibility of any survey or study. Anyone reviewing the results can determine how reliable the data is by referring to the margin of error provided. Margin of error lets researchers know how much their results differ from the larger population they are studying.
IntelliSurvey offers various market research services and products to help businesses conduct surveys and large multi-market studies. We can help your business take the guesswork out of representative sampling and data collection. Contact us for more information.

Subscribe to our Monthly Newsletter
Related posts


Testing an online survey before fielding is essential to increase survey reliability and minimize...

Are people quitting your online surveys before they finish? Surveys are invaluable tools for...