Cross tabulation, also referred to as a crosstab or contingency table, is a powerful analysis tool...

Surveys acquire information and insights from a target market or audience to inform new marketing campaigns, product developments, and more. However, analyzing the data can be challenging, especially when identifying which factors strongly correlate with the outcome of interest. This is where regression analysis comes into play.
Using regression analysis, market researchers can analyze survey data to identify patterns and relationships between variables, providing insights that fuel data-driven decisions. Here, we will explain how regression analysis works and how it can enhance survey analytics to gain valuable insights.
What is Regression?
Regression is a statistical method popular across multiple disciplines for identifying the relationship between one dependent variable (Y) and a series of independent variables. Simply put, regression helps determine how changes in one variable are related to changes in another.
The term "regression" was coined by Sir Francis Galton in 1885 to describe the relationship between the heights of fathers and sons. In his study, he observed that while sons were not usually their fathers' heights, they tended to "regress" to the population's mean. This observation led to the development of the concept of regression in statistics.
Calculating regression can help identify associations between multiple variables in a data set. Regression models predict the dependent variable's values by manipulating the independent variables' values. It is important to note that while these models can identify correlation, they cannot easily indicate causation.
What is Regression Analysis?
Regression analysis is a versatile technique widely used in various fields and industries to understand the relationships between variables and make predictions. In marketing, researchers apply regression analysis to determine the impact of advertising channels (independent variables) on sales (dependent variable).
In a regression analysis, the dependent variable represents the outcome or phenomenon of interest, while the independent variables are the factors believed to influence the dependent variable. Using the same example, the independent variables could include TV advertising spending, online marketing budget, and social media engagement.
By examining the relationships between these variables, regression analysis can uncover insights into how changes in the independent variables impact the dependent variable. This analysis helps understand which independent variables have a statistically significant effect on the dependent variable, enabling predictions and decision-making.
Why Should You Perform a Regression Analysis?
Regression analysis is a powerful tool that can help businesses gain valuable insights and make data-driven decisions. Companies can allocate resources more effectively and improve their bottom line by identifying the factors that negatively affect a dependent variable.
This analysis technique can be used across a business or organization to determine which independent variables influence a dependent variable. For example, if a company wants to improve sales, it can conduct a regression analysis to identify the factors that impact customer satisfaction. Analyzing these factors will allow the company to develop strategies to improve its products, processes, and marketing efforts.
Regression analysis can also help businesses gain insights into the complicated relationships and dynamics between variables. For instance, if a company suspects that a particular factor is impacting its sales, it can use a regression model to identify precisely its impact.
How to Calculate Regression
Calculating regression requires collecting data and analyzing the relationships between variables. Here are the basic steps of a simple linear regression analysis:
- Collect your data first and plot your results on a graph. Graphing your results will simplify the regression analysis, as you can see the correlations between dependent and independent variables.
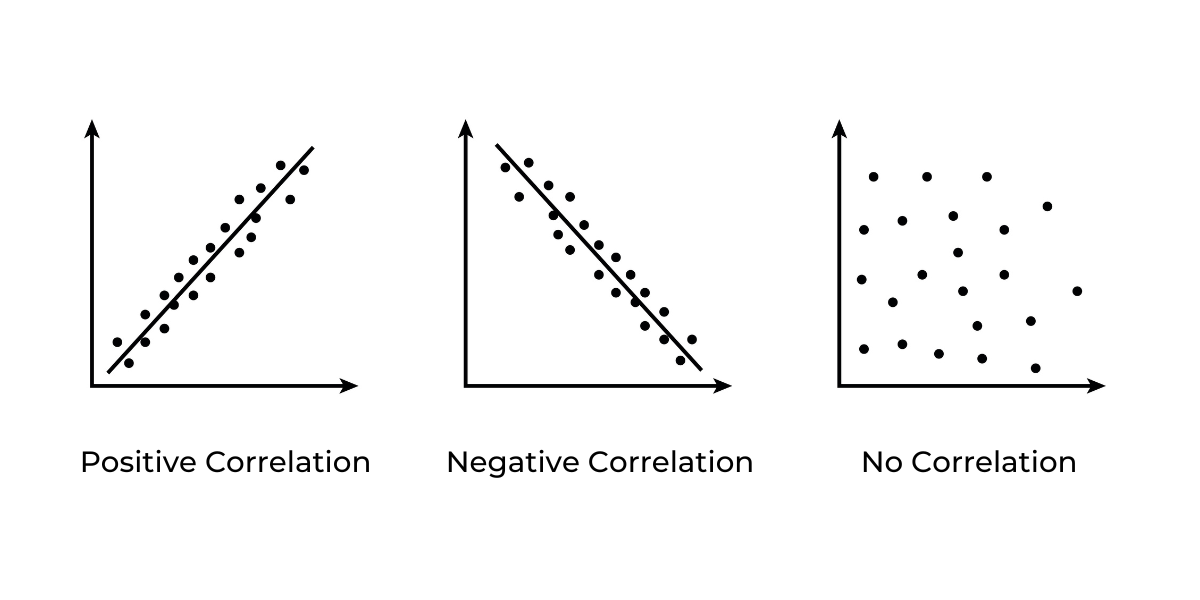
At a glance, you’ll be able to tell whether or not the relationship looks linear. Looking at the graph is more valuable than simply looking at the correlation because the correlation assumes a linear relationship. A correlation could be low not because there’s NO relationship but instead because that relationship is not linear. - Identify the dependent variable (Y) and the independent variable (X):. The dependent variable is the variable you want to predict or explain, while the independent variable is believed to impact the dependent variable. Here is where you would want to hypothesize the final model you are testing. The example provided uses ONE independent variable.
- Use the basic formula of Y = a + bX to create a line of best fit: The line of best fit represents the relationship between the dependent variable (Y) and the independent variable (X). The formula states that Y is equal to a constant (a) plus the product of the slope of the line (b) and the independent variable (X), plus an error term (u).
- Calculate the slope of the line (b) using the following formula: b = (ΣXY - (ΣXΣY)/n) / (ΣX^2 - (ΣX)^2/n), where Σ represents the sum of values, X represents the independent variable, Y represents the dependent variable, and n represents the number of observations.
- Calculate the intercept (a) using the following formula: a = Ȳ - bX̄, where Ȳ is the mean of the dependent variable, and X̄ is the mean of the independent variable.
- After calculating the slope and intercept, you can use them to predict values of the dependent variable (Y) for any given value of the independent variable (X).
Types of Regression Analyses
Regression analysis comes in different forms that can help researchers explore the relationships between variables. Below are some of the most common types of regression models.
Linear Regression Analysis
Linear regression models show the linear relationship between two variables. Simple linear regression models use one straight line to pinpoint an independent variable's relationship with a dependent variable. Linear regression usually only determines the relationship between two variables, such as price changes and how they influence sales. With linear regression, researchers can also choose the value of the dependent variable at specific points.
Linear regression analysis can be applied to real-world scenarios, such as predicting housing prices based on different variables. For instance, by collecting data on factors like the number of bedrooms, square footage, and location of houses, researchers can use linear regression to determine how these independent variables impact the sale prices. This analysis allows them to estimate the price increase associated with adding a bedroom or increasing the square footage of a property.
Multiple Regression Analysis
A multiple regression model contains more than one independent variable and uses them to predict the outcome of a single dependent variable. In multiple regression, you are still using ONE dependent variable, but the difference here is that you allow MULTIPLE independent variables. This type of regression analysis can help determine the relationships between each independent variable and the dependent variable.
Multivariate Regression Analysis
Multivariate regression analysis is a statistical technique that analyzes multiple dependent and independent variables, making it more complex than linear or multiple-linear regressions.
Since this method allows for a more holistic understanding of the relationships between variables and quantifies those relationships, it is a powerful tool for predicting outcomes in complex real-world situations.
With multivariate regression models, researchers can adjust the dependent and independent variables to understand which conditions influence them.
Multivariate regression can account for the complex interactions between numerous variables. However, multivariate techniques are complex and require advanced mathematical knowledge and statistical software to analyze the data.
Logistic Regression Analysis
The logistic regression model focuses on predicting the probability of a binary outcome based on independent variables.
In a binary outcome, there are only two possible outcomes (for example, pass or fail). A logistic regression model is viable when the result can only be one of two things.
Logistic regression models can help businesses make predictions based on independent variables that are known to influence the outcome. For example, a logistic regression model could help determine the probability of a driver winning a race based on independent variables like the weather.
Using a Regression Analysis to Improve Survey Analytics (An Example)
In this scenario, you are conducting a survey to determine which factors influence customer satisfaction with your product. Consider including questions about price, quality, customer service, and product features. Using regression analysis, you can identify which factors have the most significant impact on customer satisfaction.
In this example, the regression analysis reveals that product quality and customer service emerge as the two most significant factors affecting customer satisfaction. The data shows a strong positive correlation between high product quality and increased customer satisfaction.
Similarly, excellent customer service also proves to have a substantial positive impact on customer satisfaction levels. Armed with this information, you can take action to improve your product quality and customer service, thereby increasing customer satisfaction and loyalty.
Moreover, a regression model allows you to identify correlations between variables you may not have been aware of. For example, you might discover a strong correlation between customer age and their likelihood to recommend your product. With this information, you might test marketing efforts that target specific age groups to see which new tactics positively increase your results.
How IntelliSurvey Can Help
Regression analysis is a powerful technique that provides valuable insights into the relationships between variables. Companies can determine which factors influence a dependent variable and allocate resources accordingly to improve their bottom line.
Our robust platform includes built-in features to support your data reporting and analysis needs. We also have a dedicated research team available for more complex requests. Whatever your needs, IntelliSurvey can help your organization uncover actionable, intelligent insights for better decision-making.
If you are interested in working together, please get in touch with us for more information.

Subscribe to our Monthly Newsletter
Related posts


Many people in the United States (and elsewhere around the world) are looking forward to 2021 being...

Maximizing participation in your online survey begins with understanding your target audience. By...