Wishing you could liven up your respondent engagement? Go beyond the typical survey question types...

Cross tabulation, also referred to as a crosstab or contingency table, is a powerful analysis tool that allows researchers to compare the results of different variables. Cross-tabulation can help reveal hidden relationships and provide unique insights using structured tables to unveil patterns and trends that may not be immediately apparent.
Cross Tabulation Defined
Cross tabulation is an analysis tool for comparing the results of one or multiple variables with the results of another. With crosstabs, researchers can examine relationships in the data that are not transparent when looking at the total survey responses. Cross tabulation refers to data tables that present results from an entire group of survey respondents and their subgroups.
Crosstabs can be applied to data on a nominal scale, meaning variables are named or labeled in no particular order or sequence. This feature is exceedingly helpful when dealing with variables that lack inherent order or hierarchy.
When charting cross-tabulation, the x-axis represents one variable or question, while the y-axis represents another. This two-dimensional table format visualizes the intersection of variables, providing a comprehensive overview of the relationships between them.
Market researchers can employ cross-tabulation to go beyond a superficial understanding of datasets. It enables them to analyze subgroups within the dataset, such as specific demographics or characteristics of respondents, and uncover hidden relationships. This deeper analysis offers valuable insights that may guide decision-making and strategy development.
Creating a Crosstab Report
At IntelliSurvey, we make intelligent research easy. Our reporting dashboard includes built-in features to make crosstab creation effortless. Below is a walkthrough that shows how to create a crosstab report in our intuitive survey software platform.
Now that you’ve seen crosstab reporting in action let’s explore the benefits of cross-tabulation and examples of different use cases.
Benefits of Using Cross Tabulation
Cross tabulation is a powerful analytical tool that offers numerous advantages in data analysis. By employing cross-tabulation techniques, researchers can gain deeper insights, visualize complex data relationships, inform decision-making, identify subgroup differences, and support statistical testing.
Crosstabs help researchers explore the hidden relationships within datasets and improve their understanding of variables and their interplay.
Interpret Data Clearly
One significant benefit of using cross-tabulation is its ability to simplify data interpretation. Presenting datasets with crosstabs gives readers a more digestible format, saving time and making the process less challenging. They are easily viewed and understood without specialized analytics training.
Presenting datasets in an easily understandable format enables efficient knowledge transfer within a team, allowing all members to quickly get up to speed and make informed decisions based on the data analysis.
Reduce Errors and Confusion
Crosstabs simplify data analysis by dividing datasets into representative subgroups, enabling uncomplicated interpretation. By breaking down the data into smaller, manageable sections, researchers can focus on specific combinations of variables, making the analysis more efficient.
Crosstabs also provide transparent visual representations of the different percentages and frequencies across categories and variables. An easy-to-follow visualization can help researchers quickly identify patterns and trends, leading to deeper insights without manual calculations or complex statistical analyses.
Working with organized and structured crosstabs makes large datasets more manageable, specifically when dealing with extensive data collection. This leads to fewer errors and ensures cleaner data, as researchers can easily track and verify the information within the defined subgroups. Not only does error reduction contribute to the accuracy of the analysis, but it also translates into significant time savings by eliminating the need for correction and re-analysis.
Reducing errors and confusion saves time, allowing organizations to allocate more resources to deriving meaningful insights and drawing actionable conclusions from the data. Streamlining the data analysis process can help businesses channel their efforts into further data exploration, validation, and the formulation of effective strategies based on reliable findings.
Increase Actionable Insights
Cross-tabulation illuminates relationships and patterns typically overlooked with standard analytical approaches by organizing data into structured tables and comparing variables.
This streamlined process allows researchers to quickly identify significant associations and dependencies between variables, providing a deeper understanding of the data. Afterward, businesses can leverage these newfound insights to help inform data-driven marketing strategies, allowing them to make informed decisions based on reliable and relevant information.
Crosstabs can enable researchers to identify global trends across all survey responses through a comprehensive view. Analyzing the dataset through cross-tabulation helps identify overarching patterns and trends across various subgroups and demographics. This holistic perspective allows researchers to respond appropriately to global trends, uncover new opportunities, and address challenges by helping them understand the broader context of the data.
When to Use Cross Tabulation
When researchers have data that needs to be sorted into mutually exclusive categories (or categorical variables), cross-tabulation can be a powerful analytical tool. Crosstab reports are particularly beneficial in situations where the relationships within the data are not immediately apparent. This research method provides a structured approach to explore and understand the interplay between them, enabling researchers and businesses to extract meaningful insights and make informed decisions based on the data analysis.
Below are some examples of where employing cross-tabulation can be helpful.
Improve Employee Retention
In human resources, cross-tabulation can be invaluable for improving employee retention. For instance, an HR department may want to gauge the sentiments and experiences of employees within their organization.
Using crosstabs, HR specialists can conduct research across departments and identify relationships between two or more variables to understand better how employees feel about their roles.
Additionally, cross-tabulation can help review data from exit interviews. As a result, organizations can swiftly identify correlations between reasons for employee departures and the company's direction, informing strategies for employee retention and organizational improvement.
Enhance Customer Service Efforts
Crosstabs can significantly enhance customer service by measuring customer satisfaction levels and preferences. Using cross-tabulation, businesses can determine how different customer segments feel about their products or services, making it easier to compare feedback and satisfaction levels across regions or other relevant factors.
Crosstab analysis also enables quantifying and analyzing customer satisfaction levels between long-term and new customers, facilitating targeted efforts to improve customer satisfaction and retention. This information can be synthesized and presented in a digestible format for management to make critical decisions that enhance overall customer service strategies.
Evaluate Academic Course Material
In the academic sphere, crosstabs can be instrumental in evaluating and improving course material. For example, school administrations can cross-tabulate data from instructor evaluations with categories such as subject, time of class, and other relevant data points.
This analysis helps administrators gain insights into the effectiveness of the curriculum and make adjustments to improve the learning experience for students.
Educational institutions can also assess the adequacy of time spent on various subjects and identify areas for improvement by surveying students about their perception of course material and instructors, which can lead to enhanced academic programs and student satisfaction.
Testing Your Hypothesis: Crosstabs and Chi-Square
Cross-tabulation tables can be examined using the Chi-Square test to investigate the statistical significance of relationships between variables.
The Chi-Square statistic is calculated using the following formula:
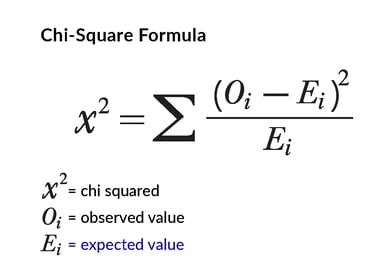
The Chi-Square statistic and its associated probability can be computed for any cross-tabulation table. The probability value, often denoted as p-value, reflects the researcher's willingness to accept a type I error, which is the probability of rejecting a true null hypothesis.
For example, a .05 (5%) probability level is typically a threshold for statistical significance. The results are deemed statistically significant if the variables are related at a probability level lower than 0.05.
Note that the probability values are cumulative, meaning the chance of incorrectly finding a relationship increases with each test conducted. Researchers can apply more stringent criteria for declaring statistical significance, such as using a significance level of 0.01 or even 0.005. By adjusting the threshold for significance, researchers can reduce the likelihood of accepting a false relationship between variables.
Employing the Chi-Square test allows researchers to test their hypotheses, determine the presence or absence of relationships, and make informed conclusions based on the statistical significance of their findings.
How IntelliSurvey Can Help
If you're looking to gain valuable insights and make data-driven decisions, IntelliSurvey's platform has integrated crosstabs within our standard reporting dashboard. Researchers can determine if variables are related or independent and make more informed decisions based on statistically significant results. Our team is happy to help you better understand your data - please contact us for more information.
Subscribe to our Monthly Newsletter
Related posts


Going beyond basic questionnaire construction and survey fielding to include advanced research...

Recently, we partnered with a long-time market research agency client on a small survey for their...