What Is Conjoint Analysis? Conjoint analysis is a marketing research method that leverages...

TURF (Total Unduplicated Reach and Frequency) analysis is a powerful marketing research method that helps businesses determine the most effective combinations of product features or attributes to maximize reach and appeal to their target audience.
TURF studies are popular among advertisers and market researchers using survey data collection services to seek insights into product features to determine what customers find most important. This article will discuss how to run a TURF analysis with survey data and explain why it's an essential tool for businesses looking to optimize their product offerings.
What is TURF Analysis?
Total Unduplicated Reach and Frequency (or TURF) analysis is a method of statistical analysis that can help optimize things like product lines, features, communication, and marketing strategies. TURF determines the most suitable combination of products and services to offer (and which to avoid) to maximize sales. A TURF analysis can help an organization identify the most effective items, product features, and configurations to reach the most potential customers without overlap (or maximizing unduplicated reach).
Essentially, TURF analysis helps businesses identify the most effective strategy to increase market share and profits with minimal waste of resources.
How Can TURF Analysis Help Your Business?
TURF analysis can provide valuable insights to businesses looking to make informed decisions on product placement, communication, and promotional strategies. Let’s explore the advantages of running a TURF analysis and how it can help your business make data-driven decisions to improve profitability and success.
Improve Customer Satisfaction
TURF tests allow businesses to understand their customers' priorities and how they make trade-offs between different product features. Understanding these preferences can help brands optimize their product offerings, ultimately improving customer satisfaction.
Giving customers too many unwanted features can lead to frustration. By using TURF analysis to streamline product lines and offer a more targeted selection of options, businesses can help customers feel more comfortable making a purchase decision.
When customers feel less overwhelmed by the number of choices, they can more easily identify what they really want and buy confidently.
Reduce Returns and Prevent Switching
Having too many choices can also lead to buyer's remorse, resulting in more returns and harming customer loyalty. Customers overwhelmed by the number of options are more likely to second-guess their purchase and return the product.
Furthermore, fear of missing out can lead customers to switch to brands that offer more streamlined products. In many scenarios, customers are often willing to trade variety for simplicity and a more straightforward shopping experience.
By providing more targeted and focused product options, businesses reduce the risk of buyer's remorse, minimize returns, and prevent customers from switching to another brand. This helps companies save money on return costs and build customer loyalty by creating a more satisfying shopping experience.
Keep Costs Down
TURF tests can benefit businesses looking to reduce costs in many ways. For example, a TURF analysis can help cut costs by setting a maximum budget for inventory and letting the algorithm find the best combination of product options to keep costs within that limit.
TURF analysis can also help evaluate different scenarios based on market changes. By analyzing customer preferences and identifying the most desired product options, businesses can adjust their inventory and offerings to meet changing market demands, helping reduce costs and increase sales.
Additionally, leveraging TURF analysis to refine a product line to the items or configurations most desired by their customers helps minimize returns and unwanted inventory. This ultimately saves businesses money by reducing waste and maximizing return on investment.
When Should You Use TURF Analysis?
TURF analysis is a valuable tool for businesses planning new product lines, creating marketing campaigns, or building new service offerings. Using TURF tests to analyze customer preferences and behaviors can help companies make data-driven decisions that accomplish their goals.
Plan a Product Line or Build a Brand Portfolio
TURF analysis is an excellent tool for businesses creating new product lines or building brand portfolios that resonate with their target market. Conducting a TURF test can help brands gain insights into the unduplicated reach of different product features and determine which ones are most important to their customers.
For instance, a business might deploy a survey that asks respondents which product features they would find essential in a new product line. Then, using TURF analysis, they can determine which combination of features would have the highest potential reach. With this data, businesses can create products more likely to appeal to their target market and avoid cannibalizing existing products.
Create Effective Marketing Campaigns
A survey question might ask respondents to rank their preferred methods of receiving information about a product or service to obtain information on the effectiveness of different marketing channels.
For example: "Please rank the following methods of receiving information about our product or service in order of preference: social media ads, email newsletters, TV commercials, radio ads, or print advertisements."
After analyzing the results of this question’s survey data, businesses can identify the most effective marketing channels to reach their target market.
Service Planning
Similar to using TURF analysis to create new product lines, TURF tests can also help construct and optimize service offerings. Analyzing the unduplicated reach of different service features can help businesses identify which features are most important to their customers.
A survey question could be, "Which of the following service features do you find most valuable?" By understanding the value of each feature to customers, businesses can make informed decisions about which features to include in their service offerings and which features to prioritize in different service tiers.
How to Perform TURF Analysis With Survey Data
By performing a TURF analysis, businesses can leverage survey responses to pinpoint their target markets' most appealing combinations of products, features, or services. Below are the steps you need to perform a TURF analysis with survey data and obtain actionable insights for future campaigns.
1. Identify Your Target Audience
When performing TURF analysis, it is critical to identify the audience that represents your market. Doing so can help determine the product combination that will reach the most significant portion of your target market.
However, capturing data from the wrong audience may result in a less-than-optimal product range. If you need help finding a survey panel that represents your target audience, IntelliSurvey's panel agnostic field management approach can help you find an audience with similar characteristics as your customers.
2. Create and Send Out Your Survey
The second step in performing a TURF analysis with survey data is to create and distribute your survey to the appropriate audience. The questionnaire should evaluate all possible options by asking respondents about their preferences.
One way to do this is to create matrix questions that ask respondents to identify the items they would be interested in buying out of a range of options. Another approach is having respondents organize their choices from least to most preferred. You can then quickly distribute your survey using an email distribution service.
3. Review the Results
After reviewing the survey results, it is crucial to go beyond simple frequency analysis and look at the unduplicated reach of each product combination using TURF analysis.
For example, if your survey asked respondents which features they would like to see in a new product, you might find that features A, B, and C are the most popular. But what if a combination of those features would appeal to a much larger portion of the market? That’s where TURF analysis comes in.
4. Perform a TURF Analysis
Performing a TURF analysis is necessary to identify the best possible combination of products that will satisfy the most customers. While a frequency analysis can help users understand the frequency of which someone selected product attributes, the TURF analysis shows the unduplicated frequency, which is essential in avoiding overlap between product features.
In the example above, you collected data about the popularity of features A, B, and C. Without TURF analysis, you might stick to the most popular option. With TURF analysis, however, you can go a step further to determine which combinations of features will appeal to a larger portion of the market, such as both A and C.
The TURF analysis results will show both reach and unduplicated frequency, enabling businesses to identify the best product or feature mix. Filtering the results based on customer characteristics can also help make powerful comparisons between customer segments.
How Does TURF Analysis Differ from Conjoint Analysis?
Conjoint analysis and TURF analysis are helpful tools for businesses to gather insights into their customers' preferences. However, they differ in their approach. Conjoint analysis involves asking customers questions to identify the importance of different features and levels within a product or service. TURF analysis is a type of calculation that runs on previously collected data to identify the best possible combination of products or features that will reach the most customers.
For instance, let's say you're a company that sells smartphones and wants to know which features to prioritize in your next release. Conjoint analysis could help you understand which combinations of features work best together, such as whether customers prefer larger screens with higher resolution cameras or faster processors with longer battery life.
On the other hand, TURF analysis could help you identify the specific combination of features that would reach the most customers in your target market, such as whether a pairing of a specific screen size and camera resolution would appeal to more customers.
An Example of IntelliSurvey's TURF Analysis in Action
During the 2020 Olympics in Tokyo, hundreds of events across dozens of sports were run over a two-week period. We were curious: What is the optimal set of 3 Olympic sports to maximize American viewership?
In the week leading up to the Olympics and over the opening weekend, we surveyed 1,000 U.S. respondents who were likely to watch the 2020/2021 Summer Olympics, “Which of the following Olympics sports are you planning on watching/have already watched this year?”
Respondents were selected from a list of 46 disciplines and a “haven’t decided” option.
Fun fact: Each sport had an accompanying pictogram. These were brought to life in a charming performance during the Tokyo Opening Ceremony, paying homage to the host country’s 1964 contribution of pictograms to the Olympic Games.
Next, we used the IntelliSurvey TURF Analysis applet to estimate an optimal 3-sport portfolio. Input can be either a multi-select or MaxDiff type question. TURF analysis considers a set of options (e.g., statements, flavors, sports) to produce subsets called portfolios. The number of items in the subset is user-specified and can be a number or a range. Unduplicated reach describes the proportion of respondents who selected at least one of the items within a portfolio. Frequency is the number of items desired within the portfolio. Thus, to find the portfolio that covers the most people and includes as many items as those folks like, look for the portfolio with the highest reach, then the highest frequency.
With a checkbox question as input, an option is considered “reached” if a respondent selects it. Unduplicated reach extends beyond a basic frequency as it searches to include a combination of options that covers different respondents (i.e., a portfolio with a little bit for everyone). Let’s look at our basic frequency results for the top six sports.
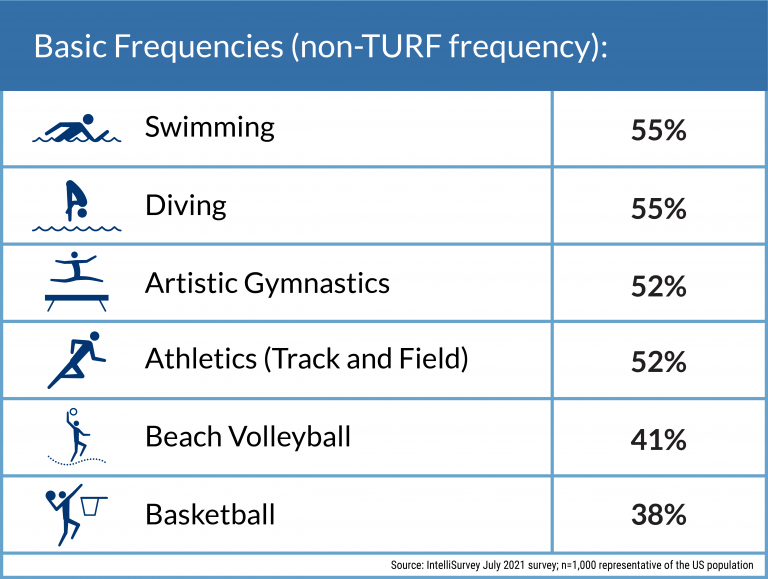
Swimming, diving, gymnastics, and athletics all exceed 50% of our N=1,000 sample. However, if we were to pick only three to feature for prime-time coverage, how could we be sure we would not be serving the same ~50% of viewers? TURF gives us another view.
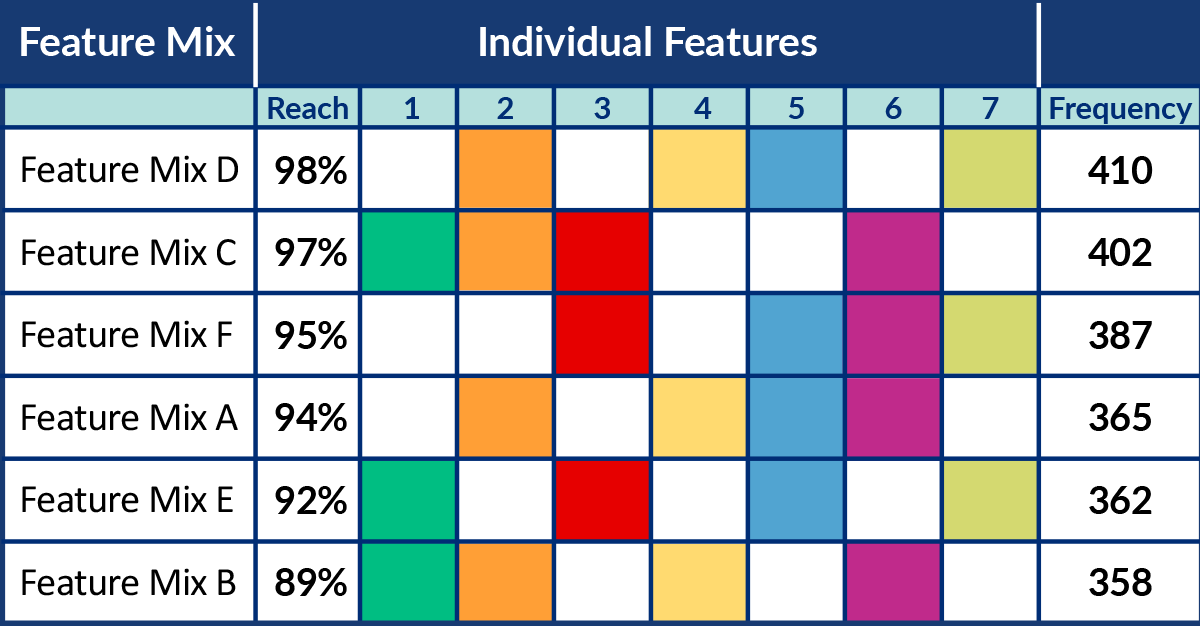
TURF Results: Optimal 3-Sport Portfolio
84% reach (the number of respondents in the sample who selected at least one item in the portfolio); 1.57 frequency (average number of appealing sports per respondent):
- Swimming
- Artistic Gymnastics
- Athletics (Track and Field)
The portfolio with the highest reach (84%) and highest frequency (1.57) included swimming, artistic gymnastics, and athletics. Although diving has a 3% edge over artistic gymnastics and athletics in terms of a basic frequency, the TURF portfolio did not include it. This suggests there is some overlap in respondents who plan to watch diving and at least one other sport (perhaps swimming), which was included in the portfolio.
The TURF results are presented in an Excel export and include every combination. The Swimming-Diving-Artistic Gymnastics combination has a reach of 82% and a 1.62 frequency. Therefore, the impact of the overlap: -2% reach, +.05 frequency, compared to the Swimming-Artistic Gymnastics-Athletics portfolio. This new solution would draw in fewer Olympic viewers than the former, but it would increase the number of sports some viewers would like to see. The preferred portfolio may be guided by theory and client needs rather than strictly by the numbers.

Intelligent Research With IntelliSurvey
IntelliSurvey offers survey design, programming, fielding, and analysis to help businesses create impactful market studies that yield optimal response rates for TURF analysis. Our advanced market research survey tools make it easy to design and distribute surveys that can capture the preferences of your target audience. We also have a panel-agnostic multisourcing approach, which allows us to find an audience with the same characteristics as your customers if you're having trouble sourcing a survey panel with enough respondents representing your target audience.
Our powerful data analysis tools include TURF analysis and advanced filters to compare customer characteristics and customer segments. Our team of experts can also assist with more advanced analytics to help you understand and interpret the results of your TURF analysis.
IntelliSurvey provides the tools and expertise to help you get the most out of your survey data. We focus on delivering actionable, intelligent insights that can support better decision-making for businesses of all sizes. Contact us today for more information.

Subscribe to our Monthly Newsletter
Related posts


In the healthcare industry, things move quickly, and employment is no exception. Health eCareers...

In survey research, the quality of data collected directly impacts the validity and usefulness of...