When it comes to product development, online surveys play an essential role in understanding...

Ad hoc reports are one-time reports created on-the-fly using dynamic survey data to find quick answers to immediate questions. While traditional statistical reporting requires data analysts or IT to create and distribute reports, ad hoc reporting is a business intelligence process that can be conducted by almost any team member, regardless of technical expertise.
Unlike routine reports, ad hoc reporting is used for more immediate information needs, such as crosstab reports, field management metrics, or TURF analysis using self-service tools like those in the IntelliSurvey data analytics platform. For example, when a colleague walks up to your desk and asks for information on whether your survey respondent quota has been met, you can run a one-off ad hoc report to answer their question quickly.
These reports can then be used for ad hoc analysis, which explores and examines the data to draw tangible conclusions based on the information.
Ad Hoc vs. Canned Reports
Static or “canned” reports are reports automatically generated on a regular schedule based on pre-set criteria. They save time and energy when stakeholders need different formats with varied delivery requirements regularly, such as a monthly financial reporting package for the CFO that includes a balance sheet, P&L, cash flow statement, operational metrics, etc...
By contrast, ad hoc reporting allows users to create their own reports based on a snapshot of real-time data as needed. These reports are typically run within seconds to answer specific business questions, such as how many units of a particular product were sold in the past week or how many respondents in a given demographic have completed a survey. In addition, reports are presented in a highly visual format, making the results easy to understand by the end user.
Benefits of Ad Hoc Reporting and Analysis
The most significant benefit of ad hoc reporting is that anyone can use them to gather the data they need to make critical business decisions, with no technical knowledge required. Personnel running ad hoc reports may include managers, marketing, sales teams, and executives.
When time is of the essence, ad hoc reporting enables businesses to quickly find answers to a question without waiting for traditional reports and analyses that take hours or even days to run.
Ad hoc reports using survey data are:
- Quick to run
- Easy to serve a specific niche audience
- Flexible in a constantly changing environment
- Visually presented for ease of understanding
- Able to reduce IT workload and costs
- Completely customizable to answer a variety of questions
- Key to organizational agility
As you can see, ad hoc reporting has numerous benefits that allow businesses to take advantage of their survey data or other business intelligence quickly and with as few barriers as possible.
When to Use Ad Hoc Reporting (Real-World Examples)
As mentioned, ad hoc reports are not a replacement for canned reports but rather an additional tool in your business arsenal when analyzing data on demand. For example, ad hoc tools built into the IntelliSurvey reporting dashboard allow you to generate real-time reports as soon as day two of fielding your survey.
Use cases for ad hoc reporting include financial reporting, budgeting & planning, operational reporting, and more.
Healthcare
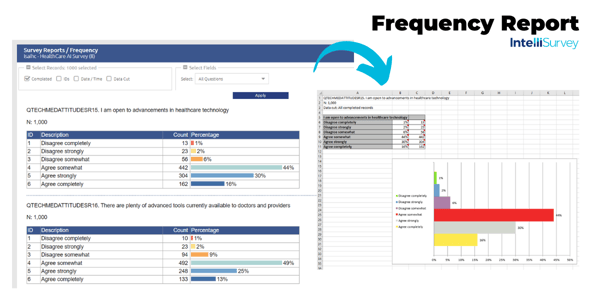
Survey data in healthcare is massive, and there is data available for every possible metric. Healthcare organizations may commission surveys, such as one to understand consumer attitudes toward AI in a clinical setting, to stay ahead of the curve and improve patient care.
Finance
Ad hoc reporting in finance allows organizations to drill down to any financial information they may need. For example, they might use ad hoc reports to measure the YTD profitability of a specific store location. If they’ve recently run a market research study, they may use ad hoc reports and analysis to assess the viability of a new product line.
Sales Teams
Sales teams often need to present performance metrics for their clients. In the case of wealth management organizations, this may include performance metrics for investment options. In addition, for organizations that have recently run a survey on B2B IT decision makers, sales managers may use an ad hoc report to identify demographics with the most significant demand for their product.
Retail
Ad hoc reports can be used to answer various questions for consumer retailers, such as inventory tracking, customer retention indicators, and ways to better personalize their customer service experience.
How to Generate Ad Hoc Reports
Many reporting tools are available to help organizations analyze data and generate reports. However, when analyzing quantitative survey data, you want to look for a platform with built-in tools that allow you to quickly and effectively run ad hoc reports.
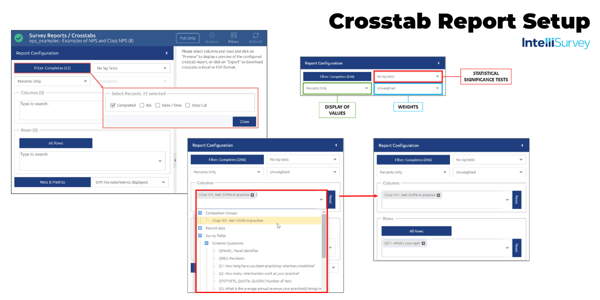
The best survey reporting dashboards will have an intuitive user interface, real-time data access, data from multiple sources, and export options allowing you to share reports easily. Additionally, you’ll want to closely examine which advanced self-service features the platform includes, such as data cuts and weights, frequency reports, and visualizations.
4 Tips to Create Better Ad Hoc Reports
While the tool you use will do most of the heavy lifting, there are several best practices you can employ.
Start With Your Question
Ad hoc reporting aims to answer a question. When designing your report, it’s essential to understand why the question is being asked. Knowing the context and how it will drive business decisions is vital to an effective report.
Once you understand the question and the context, check existing reports to ensure the question isn’t already answered elsewhere. If you find the answer in an existing report, take the extra step to review the data, as there may be room to improve the layout, make the solution more concise, or dig deeper to reveal additional insights.
Use Simple Visuals
Keep the data elements in your report minimal so you do not overwhelm the reader with too much information. If you cannot fit all the data you want to display into a single report, consider breaking it up into two reports instead. This issue often arises when two audiences ask a similar question but have different context needs, such as sales vs. marketing.
Your visuals should also include a positive or negative indicator for KPIs, such as projected sales compared to actual sales over a given period. This adds the necessary information for the reader to understand the data presented in the report quickly.
Place Aggregate Data Appropriately
Aggregate data points should be placed thoughtfully in the report with consideration of the audience that will be using it. Displaying it separately from the body of the report is often helpful.
For example, sales managers will find aggregate data such as total sales per quarter important. As such, they will appreciate a report emphasizing this data so they can find it quickly and easily. One way to accomplish this is by including it in an executive summary at the report's top. Other ways to emphasize this data include using bold font, contrasting colors, or graphical displays in the side margin.
Improve Your Report Layout and Design
Minor adjustments to your ad hoc report can considerably affect readability and the value it provides the recipient. KPIs should take the most important positions, with other elements playing a secondary or tertiary role in the visual hierarchy. Sort order, grouping, and other filter criteria should be limited to reduce the amount of data a reader needs to process, and design should be consistent across all pages, including fonts, colors, layouts, and other design elements.
How IntelliSurvey Can Help
At IntelliSurvey, we understand the importance of actionable data reporting and analytics. Our reporting tools are built along with your survey, allowing you to access real-time results in the field as early as day two. From ad hoc performance trackers to advanced analytics, our platform includes the provisions to run in-depth reports, regardless of technical ability. Our research team can also help with more complex or custom requests. Please get in touch with us for more information on how we can help with your reporting needs.
Subscribe to our Monthly Newsletter
Related posts


A brand funnel is a concept in marketing that explains the journey a customer takes from first...

Artificial intelligence (AI) is on the rise across various industries, and the healthcare sector is...