The CEO wants Nikita’s recommendations next Thursday. Today is Monday. Tight schedule. The survey...

Edward, a C-level executive, accepted an invitation to take a survey sponsored by a global cyber security organization for which he was an active member. Being a cyber security nerd, one thing Ed wanted to evaluate was if the survey was hosted securely. Also, the invite mentioned something about him getting his survey results. We’ll see, Ed thought.
A few days earlier…
The folks sponsoring the survey were busy finalizing the details. They sprang a request on their market research vendor. “We want participants to receive a copy of how they assessed their organization’s cyber security preparedness, in graphical form. We’ll collect email address in-survey. Can IntelliSurvey prepare and send each respondent a PowerPoint file showing their self-assessment graph?”
Michael, the IntelliSurvey project lead, asked internally for resources to accommodate the building of about 70 PowerPoint files, along with their delivery. Rick (the IntelliSurvey software product manager) responded, “If they want it per respondent, that’s more of a custom survey code sort of thing, isn’t it?” and posted a link to a software toolset used in the reporting functionality of the IntelliSurvey platform. Rob took that link and ran with it. Rick sorted out various technical pieces. Solution produced. A spider chart* would be rendered in-survey, and respondents would have their choice of download formats. No need to collect email addresses. No need to make busy executives wait days for results by email. Brilliant.
Edward takes the survey…
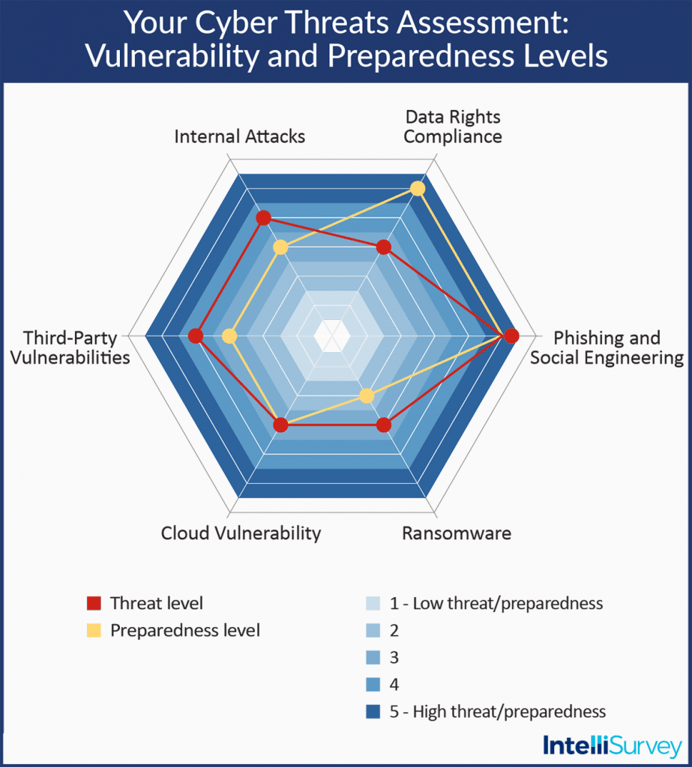
Ed hit the survey link and looked under the hood using developer tools. He found the survey webpages were in fact properly secured. Good. He continued, answering questions from his organization’s perspective regarding six types of cyber threats. Then he saw a chart rendered, plotting his assessments of threat level and preparedness. Wow, that was quick, he thought. A spider chart with six vertices, a red line for threats, and a green line for preparedness. Plus, a menu button to choose download format. Ah! His survey results as the invitation promised. Nice. A spider web for Ed.
Coda…
We understood the objective of the client request to distribute a graphical result to each respondent and brought an alternate solution which had key advantages:
- Immediate fulfillment for the respondent
- Avoided respondents’ reluctance to share their email address, wait time, and possibility of email with attachment being blocked by corporate firewall or local SPAM filter. (It was a cyber security expert audience after all!!)
That’s Ed’s story, what’s yours?
* Spider charts are also referred to as polar or radial charts.
Subscribe to our Monthly Newsletter
Related posts


At IntelliSurvey, our commitment to enhancing client experiences and accelerating project timelines...

Calculating the margin of error is vital to research and survey data collection. Researchers rely...