Continuing our blog post series about the new e-book, Overcoming the Biggest Threats to Market...

Confidence intervals are a fundamental tool for estimating population parameters and measuring uncertainty. Understanding how to calculate and interpret confidence intervals is essential to make reliable conclusions and informed decisions based on sample data.
Here, we will explore the concept of confidence intervals, their significance in statistical analysis, different types of confidence intervals, and step-by-step instructions on calculating them.
What Are Confidence Intervals?
Confidence intervals are statistical ranges or intervals that estimate the likely range of values for a population parameter, such as a mean or proportion. These intervals are based on survey data and aim to capture the true value of the parameter within a certain level of confidence. As such, they are an essential component of inferential statistics and a fundamental building block for market research.
A confidence interval consists of two numbers: lower and upper bound. The parameter is estimated to lie within this interval with a certain confidence level.
Confidence intervals help researchers determine if the data they collect with one group will remain the same if they increase their sample size.
Confidence Levels Explained
Confidence levels serve as a way to gauge the uncertainty associated with a confidence interval. They indicate the likelihood that the calculated confidence interval contains the true population parameter.
For example, a confidence interval of 90% means that if we repeat the same statistical analysis multiple times, approximately 90% of the resulting intervals or estimates would encompass the true population parameter. In other words, there is a 10% chance that the interval or estimate will fail to capture the actual value.
The decision on which confidence level to use is determined by the researcher and reflects the desired confidence level in the estimation. The most commonly used confidence levels are 90%, 95%, and 99%. Opting for a higher confidence level requires a wider interval, encompassing a broader range of potential parameter values. Conversely, a lower confidence level corresponds to a narrower confidence interval, albeit with a decreased level of certainty in capturing the true parameter.
Selecting an appropriate confidence level depends on the specific context, the implications of estimation errors, and the trade-off between precision and confidence. Different fields and scenarios may necessitate different confidence levels based on their requirements and the acceptable level of risk associated with the analysis.
Types of Confidence Intervals
Confidence intervals come in two distinct types: one-sided and two-sided. A one-sided confidence interval estimates a parameter's range in one direction, either the upper or lower bound.
In contrast, a two-sided confidence interval provides a range encompassing the upper and lower bounds. Learn more about each type below.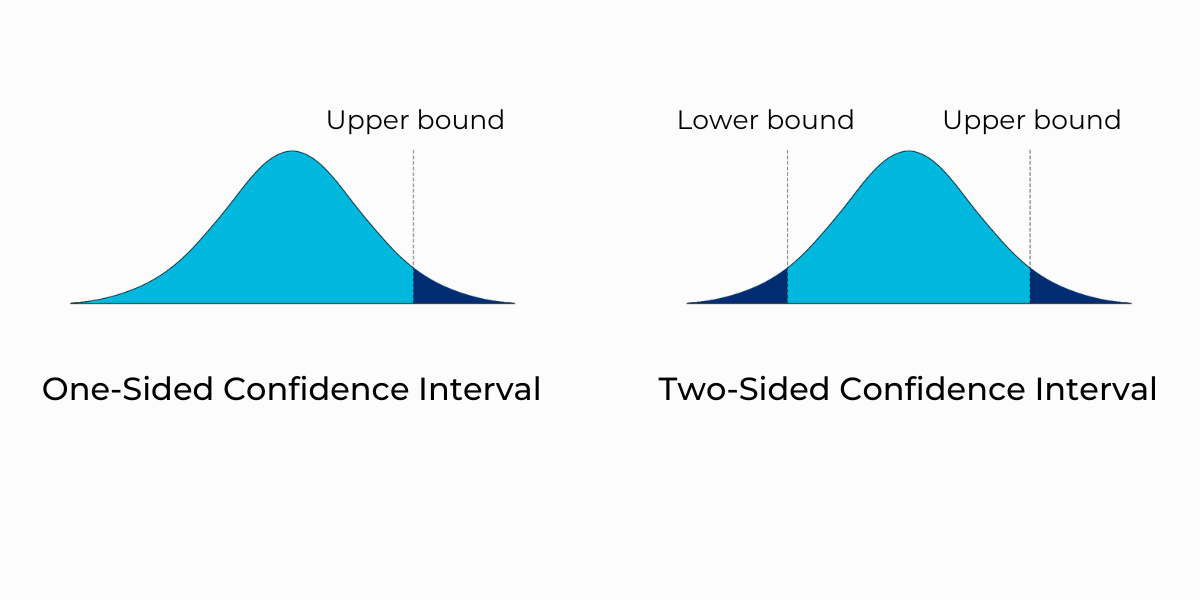
One-Sided Confidence Intervals
A one-sided confidence interval is an interval estimate focusing on only one side (either the upper or lower side) of the estimated parameter. One-sided confidence intervals provide a range of values expected to contain the parameter of interest either above or below the point estimate. This type of interval is helpful when the direction of interest is known or when there is a specific hypothesis or question about the parameter being tested.
An ideal scenario to use a one-sided confidence interval is when you want to determine if the parameter is larger or smaller than a specific value based on prior knowledge or hypothesis.
For example, a pharmaceutical company testing a new drug to reduce blood pressure has a hypothesis that the new drug will lower blood pressure compared to the existing standard medication. In this scenario, a one-sided confidence interval can help estimate the potential reduction in blood pressure caused by the new treatment.
The interval will focus on the lower side, providing a range of values expected to capture the potential decrease in blood pressure. This allows the researchers to assess whether the new drug reduces blood pressure compared to the standard medication based on the observed data and the calculated one-sided confidence interval.
Two-Sided Confidence Intervals
A two-sided confidence interval is an interval estimate considering both the estimated parameter's upper and lower sides. It provides a range of values expected to contain the parameter of interest around the point estimate symmetrically. Two-sided confidence intervals are ideal when the magnitude and direction of potential deviations from the point estimate are of interest.
An ideal scenario to use a two-sided confidence interval is when you want to determine the likely range of values for the parameter without making any specific assumptions about the direction of the difference or when you are interested in testing for the presence of any difference from a null value.
For instance, suppose the pharmaceutical company is conducting a clinical trial to assess the efficacy of two treatments for a specific medical condition. The researchers are interested in comparing the mean symptom reduction between the two treatments. However, they have yet to make prior assumptions about the direction of the difference.
In this case, a two-sided confidence interval can help estimate the likely range of the difference in symptom reduction between the treatments. The interval will provide a symmetric range of values around the point estimate, enabling the researchers to determine if there is a statistically significant difference between the treatments regarding symptom improvement without assuming which treatment is superior.
Applying a two-sided confidence interval allows pharmaceutical researchers to objectively evaluate the comparative effectiveness of different treatments, considering the possibility of either treatment outperforming the other. It provides a balanced and unbiased approach to assessing the potential impact of the treatments on symptom reduction.
Why Confidence Intervals Matter
Confidence intervals are critical in statistical analysis because they help measure uncertainty and reliability in estimation. They offer a range of values within which the true population parameter is likely to fall based on the sample data.
Confidence intervals matter because they enable researchers, decision-makers, and analysts to make informed judgments and draw conclusions about the population based on sample information.
Some ways confidence intervals assist statistical analysis are:
- Estimating uncertainty: Confidence intervals measure the uncertainty associated with estimating population parameters in marketing and research studies.
- Testing hypotheses: Confidence intervals help evaluate hypotheses by determining if a hypothesized value falls within the estimated interval.
- Comparing groups or conditions: Confidence intervals allow for comparisons between groups or conditions by estimating the difference between the parameters alongside a measure of uncertainty.
- Assessing reliability: Confidence intervals help researchers confirm the reliability of their findings by providing a range of plausible values for the parameter of interest.
- Decision-making: Confidence intervals aid decision-making processes by offering a range of values within which the true population parameter is likely to fall, helping researchers make informed choices.
- Communicating results: Confidence intervals offer a more informative way to relay study findings than point estimates alone. They provide a range that captures the plausible values, conveying the uncertainty and variability inherent in the data.
- Evaluating marketing strategies: Confidence intervals can be used to evaluate the effectiveness of marketing strategies or interventions by estimating the impact or effect size with the associated uncertainty.
How to Calculate a Confidence Interval (With Example)
Calculating a confidence interval is a fundamental statistical technique that enables researchers to estimate a range within which a population parameter is likely to fall. Understanding how to determine the appropriate confidence level, collect a representative sample, calculate the sample mean and standard deviation, and apply the proper formula will equip you with a powerful tool for data analysis.
1. Determine the Sample Size (n)
The first step is determining the sample size, representing the number of observations or measurements taken from the population.
Suppose you collect data on the heights of 100 randomly selected individuals. In this scenario, the 100 randomly selected individuals are your samples (n).
2. Find the Mean (x)
Next, compute the average value of the sample observations by summing all the values and dividing by the number of samples.
Using the same example, you would calculate the mean height by adding the heights of all 100 individuals and dividing by 100.
3. Calculate the Standard Deviation (s)
After finding the mean, the next step is calculating the standard deviation. The standard deviation measures the dispersion or variability of the data points around the mean.
To find the standard deviation in this example:
- Subtract the mean from each individual's height and square every result
- Find the mean of those squared values
- Calculate the square root of this result
4. Calculate the Standard Error
With the sample mean and the standard deviation, you can now find the standard error of the sample. The standard error lets you know how accurately your sample represents the entire population.
To find the standard error, divide the standard deviation by the total number of data points in the sample size. In this scenario, you would divide the standard deviation by the number of individuals (100).
5. Identify the Margin of Error
The margin of error tells you how many random sample errors are in the data being analyzed. A larger margin of error equals less confidence in reaching the same results for an entire population.
In this example, you would divide the standard error by two to find the margin of error.
6. Calculate the Confidence Interval
Finally, calculate the confidence interval using the formula: Confidence Interval = x ± (Z * s / √n), where x is the sample mean, Z is the Z score, s is the sample standard deviation, and n is the sample size.
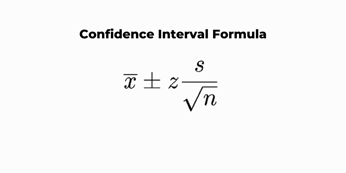
Use the sample mean, standard deviation, sample size, and Z score to calculate the formula for the confidence interval. The specific formula depends on the estimated parameter and the assumptions of the data.
7. Draw a Conclusion
Interpret the confidence interval in the context of the problem. This involves stating the range of values likely to contain the true population parameter with the chosen confidence level.
Based on the calculations, the 95% confidence interval for the population mean height is [65.2 inches, 67.6 inches]. This means that we can be 95% confident that the true average height of the population lies within this range.
How IntelliSurvey Can Help
Understanding confidence intervals is essential for accurate statistical analysis and informed decision-making. Confidence intervals provide a measure of uncertainty and allow us to estimate the likely range within which the true population parameter lies. Confidence intervals provide a solid foundation for drawing reliable conclusions and making data-driven decisions by incorporating the variability inherent in data.
At IntelliSurvey, we understand the importance of robust data reporting and analysis. Our platform offers powerful features to support your research needs, and our dedicated research team is available for more complex requests. Whether you're conducting surveys, market research, or any data-driven project, IntelliSurvey can help your organization uncover actionable insights for better decision-making.
If you'd like to leverage our expertise and resources, contact us for more information. Together, we can unlock the potential of your data and drive meaningful results.

Subscribe to our Monthly Newsletter
Related posts


MaxDiff is a powerful tool for prioritizing customer preferences. However, it can be overwhelming...

Psychology research states that the average adult's attention span is approximately 20 minutes. So,...